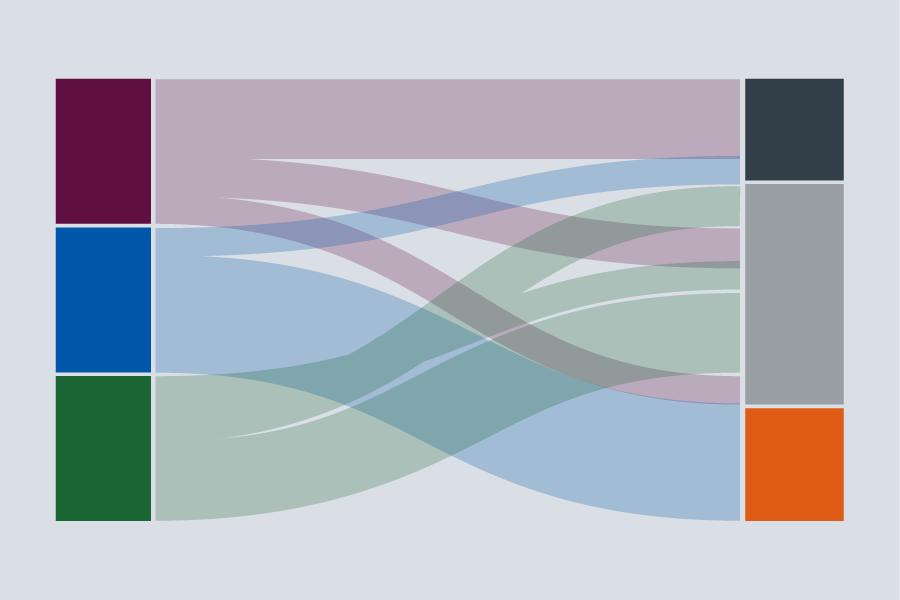
Types of data visualizations
Data visualization
There are many categories to consider when creating your data visualization. Here are some common types of visualizations.
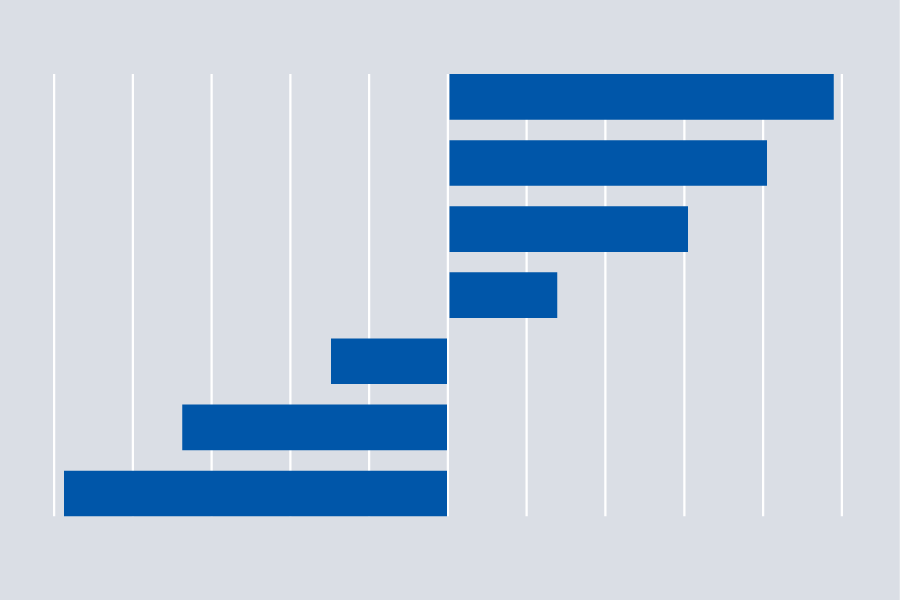
Deviation
Emphasizes variations (+/-) from a fixed reference point.
Chart types include:
- Diverging Bar Chart
- Diverging Stacked Bar
- Spine Chart
- Surplus/Deficit Filled Line
Correlation
Shows relationship between two or more variables.
Chart types include:
- Scatterplot
- Line + Column
- Connected Scatterplot
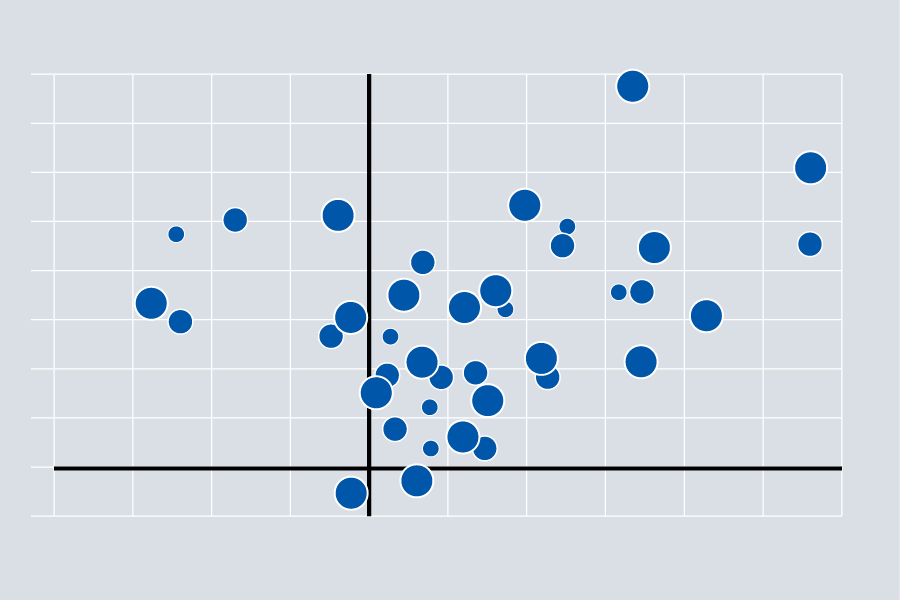
- Bubble Chart
- XY Heatmap
Ranking
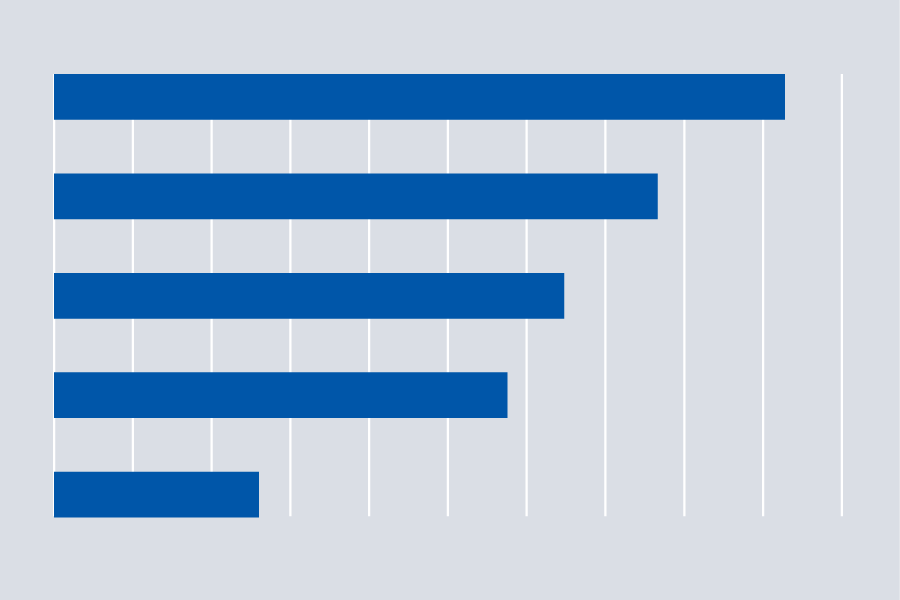
Shows an item’s position in an ordered list.
Chart types include:
- Ordered Bar
- Ordered Column
- Ordered Proportional Symbol
- Dot Strip Plot
- Slope
- Lollipop Chart
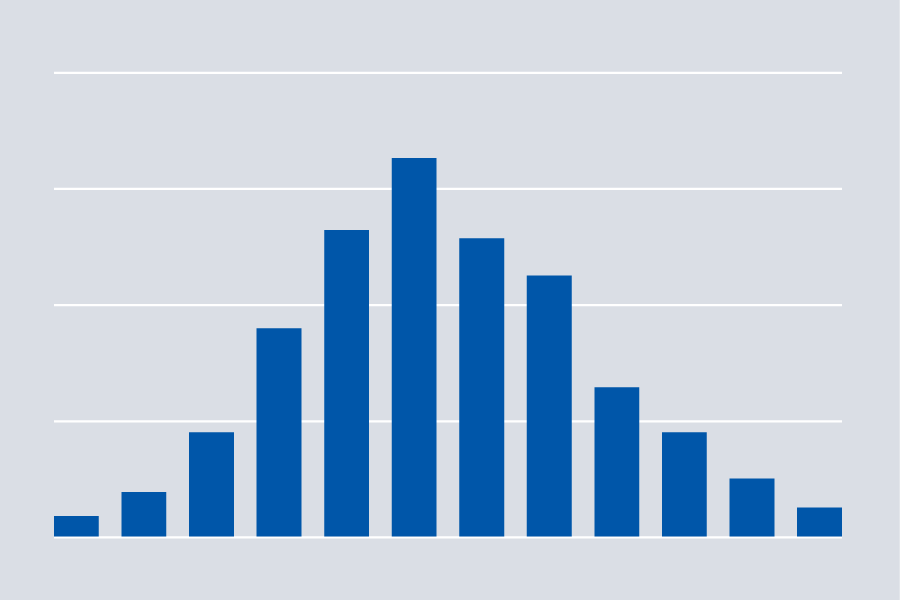
Distribution
Shows values in a dataset and how often they occur.
Chart types include:
- Histogram
- Boxplot
- Violin Plot
- Population Pyramid
- Dot Strip Plot
- Dot Plot
- Barcode Plot
- Cumulative Curve
Change of time
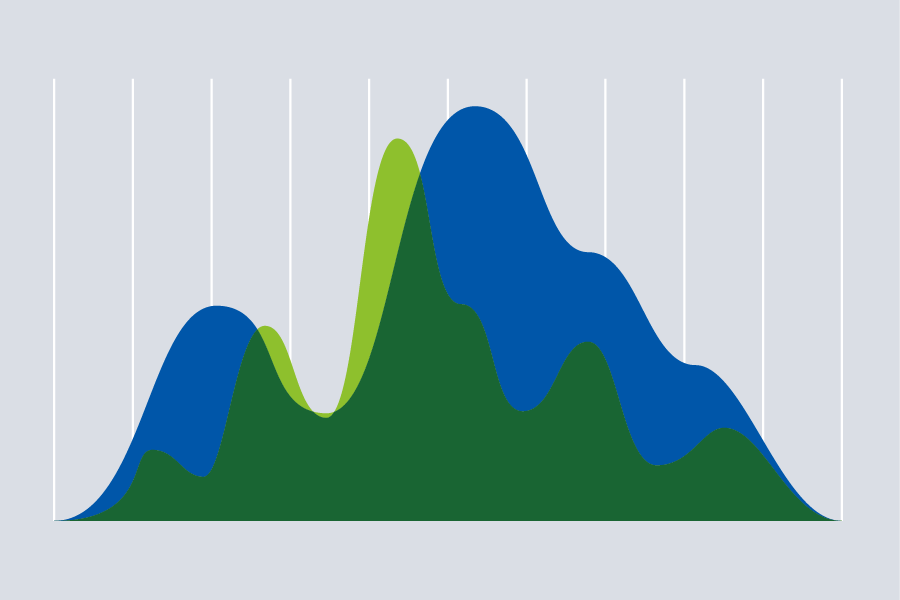
Emphasizes changing trends over a designated period of time.
Chart types include:
- Line
- Column
- Line + Column
- Stock Price
- Slope
- Area Chart
- Fan Chart
- Connected Scatterplot
- Calendar Heatmap
- Priestly Timeline
- Circle Timeline
- Seismograph
Composition (Part-of-whole)
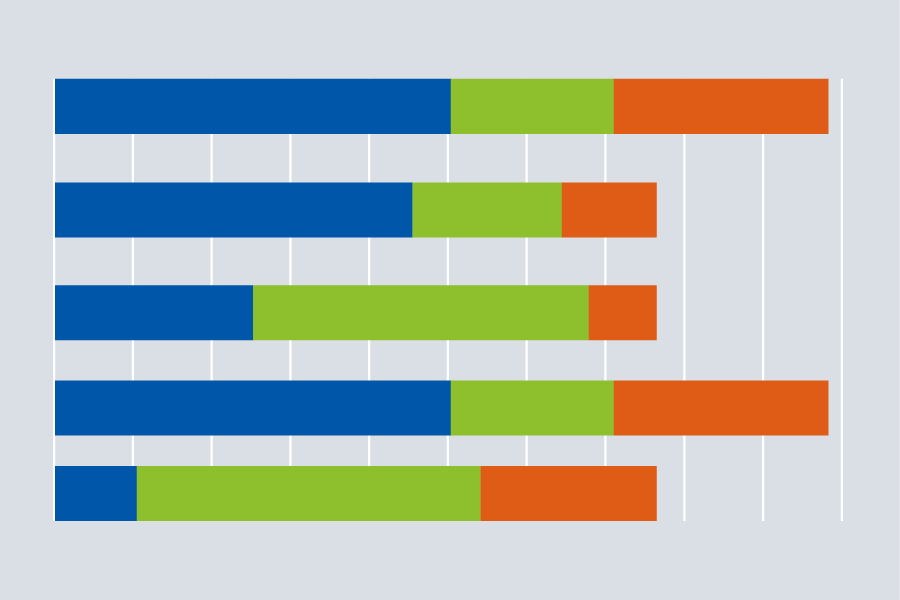
Shows how a single entity is broken down into its component elements.
Chart types include:
- Stacked Column
- Proportional Stacked Bar
- Pie Chart
- Donut Chart
- Treemap
- Sunburst Arc
- Gridplot
- Venn
- Waterfall
Magnitude
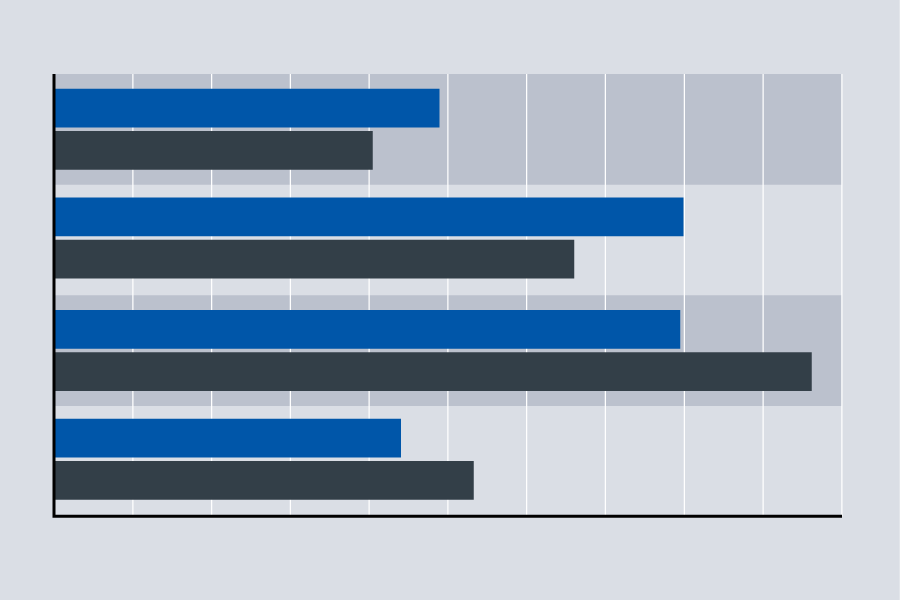
Shows size comparisons (usually a “counted” number of items).
Chart types include:
- Column
- Bar
- Paired Column
- Paired Bar
- Proportional Stacked Bar
- Proportional Symbol
- Isotype (Pictogram)
- Lollipop Chart
- Radar Chart
- Parallel Coordinates
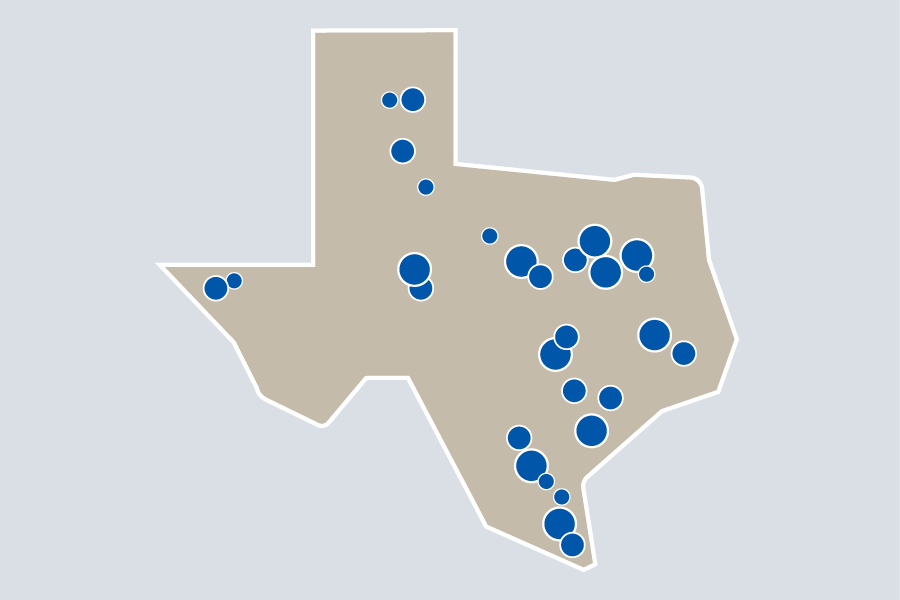
Spatial
Shows precise locations and geographical patterns in data.
Chart types include:
- Basi Choropleth (rate/ratio)
- Proportional Symbol (count/magnitude)
- Flow Map
- Contour Map
- Equalized Cartogram
- Scaled Cartogram
- Dot Density
- Heat Map
Flow
Shows volumes or intensity of movement between two or more states or conditions.
Chart types include:
- Sankey
- Waterfall
- Chord
- Network
